
Last week we looked at how to assess reporting in your organization, this post will address the why’s of reporting in order to define what should be reported and when. Although we didn’t cover the other 2 W’s (who, and where), these should be somewhat obvious.
Purpose of reporting (the WHY)
Reporting is supposed to provide information to assist in managing of the business. The sooner one can identify any key issues, the quicker a solution can be identified and implemented.
Let’s use a non-traditional example that hopefully any Cub’s fans will appreciate:
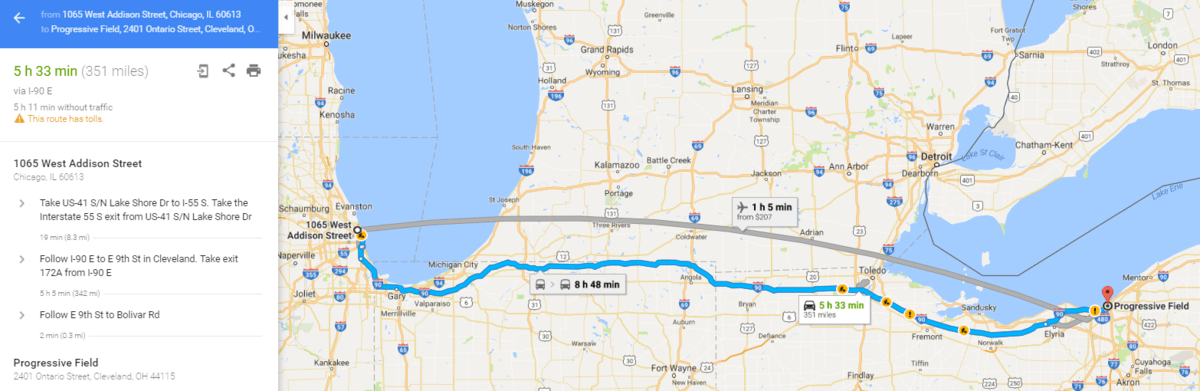
Suppose you were going to drive with a group of friends from Chicago to Cleveland this past Wednesday to catch Game 7 of the World Series. Per Google Maps, the distance is 351 miles, 5 hours 11 minutes (without traffic), from Wrigley Field to Progressive Field. The game was scheduled to start at 8:00 pm ET. Knowing there will be some stops, and potentially traffic (in downtown Cleveland), you decide to budget 6.5 hours. Therefore, you leave at 12:30 (Central time) in the afternoon.
Since everyone was in a hurry to leave town and wrap up work, no one grabbed lunch ahead of time. So, once inside Indiana, away from the greater Chicagoland area, there is a stop for lunch at mile 23. Hopping back into the vehicle, it’s now 2:10 (Central), 1:40 minutes after leaving, but only 47 miles have been covered. Traffic was a little heavy leaving Chicago, and the stop just took longer. Now it’s another 4:37 to get to the ballpark (an extra 15 minutes due to traffic / construction), and adjusting for the time zone, would indicate an arrival of 7:47 pm, with only 13 minutes to spare before the game. Knowing that traffic will be worse closer to game time, now you realize you are behind on time (i.e. over budget).
The really paranoid one amongst the group (Jake) starts running numbers to assess all the options. Instead of driving the speed limit of 70, by increasing to 75 mph, the group can pick up almost 25 minutes over the next 300 miles. Everyone agrees to increase the speed, however, the driver insists everyone else has to pay for any speeding ticket and watch out for cops.
Not satisfied that the new arrangement will be enough, Jake starts clocking every mile marker, which should come every 48 seconds if maintaining a speed of 75 mph. On top of that, every 10 miles or so, he keeps looking at the mileage remaining until the tank is empty. While the vehicle was at 405 miles remaining at the last stop, since they are exceeding the speed limit, fuel consumption will be less than optimal. Every half hour, he refreshes the navigation software to recalculate the arrival time to assess traffic and make sure the realized gains (extra speed) are making the right impact.
At two hours out, one of the passengers pipes up and says that he won’t be able to make it without stopping to go to the bathroom. The other 3 don’t want to stop, the lone dissenter is vastly outnumbered. He strikes a deal to drive the remaining stretch and drive 80 mph to make up lost time from the bathroom stop.
What does all this have to do with reporting? I’m getting to it, and quickly.
What to Report and When:
The items that should be reported are those that provide insight into what is happening with the business and can help managers stay informed and also make the right fact-based decisions.
Let’s take our road trip example above and translate it to the business world:
- Trip to Cleveland = Annual Budget
- Assessing the time remaining every half hour = Monthly Budget
- Gas consumption every 10 miles = Weekly Snapshot
- Calculating average speed every minute = Daily Reporting
Now, if you think that monitoring your average speed every minute on a 350 mile road trip seems a little OCD, welcome to management in the business world. That’s what some people get paid for, to fret about hitting a target.
Obviously, we have listed out 4 different reporting timeframes (Daily / Weekly / Monthly / Annual), and they all have their place. The overall roadmap (no pun intended) is the annual budget, but you cannot let a year go by to know if you have achieved the goal. Therefore, this needs to be broken down into smaller pieces to provide feedback along the way.
Daily Reporting – Ideally, this is a quick snapshot to stay informed (such as a quick glance at the speedometer). Any major issues should cause a re-assessment, but otherwise, not much time should be spent on it as it can become a major distraction, or make it feel like everyone is running from one side of the boat, then to the other. The following items can be useful for daily reporting:
- Sales (everyone wants to know sales)
- Orders Received (to anticipate sales issues, inventory requirements, and possibly staffing levels)
- Overtime (to identify labor issues)
- Production Levels (for manufacturing, can identify potential shortages or staffing challenges)
- Customer wait times (for call centers – heck, these are usually reported by hour throughout the day in some places)
Weekly Reporting – This should be more comprehensive than daily reporting, as it should take into account more data points and be less subject to as many swings from day to day. The following are some items that can be useful for weekly reporting:
- Sales
- Orders received
- Inventory levels (useful for determining problems related to out of stock, or excess)
- Past Due Receivables (can be used to produce a game plan each week for the worst accounts, might also impact future shipments)
- Freight costs for shipping (useful for companies that ship a significant amount of product via a courier, this variable expense can impact monthly profitability)
- Product Quality (internal scrap, customer complaints, product returns, etc.- all can highlight operational issues)
- Overtime (this can be indicative of other labor issues)
Monthly Reporting – This level of reporting should be very comprehensive at all levels of the organization, as the timeframe is meaningful enough to compare to a budget and other periods (such as the prior year). Since this can tie into a monthly close process, you can utilize full accrual accounting, which does the best job of capturing all income and expenses, allowing the most consistent data to be used (if the internal controls are up to par).
Keep in mind, if there are major unforeseen surprises in the monthly reports, then the interim reporting may either be flawed or incomplete. For instance, if you know that you are hitting your average daily / weekly target, the monthly figure should arrive as planned.
Why, Revisited
Expanding on my two sentence explanation of why from above, I can now tie it back to our example. In order to arrive at Game 7 on time (hitting the annual plan), a certain average speed is required (daily sales). By continuously monitoring the speed, you can make adjustments as needed. The team identified solutions along the way to get back on plan after falling behind (by increasing the speed and sharing in the workload – i.e. watching for police). It is much easier to make up 25 minutes over 300 miles, than trying to do so over 150 miles.
At the end of the day, leaders have to manage their stakeholders, which includes investors, lenders, supervisors, employees, customers and suppliers. Your job in managing stakeholders is to avoid major surprises, and if there is a surprise, an earlier warning is generally better. By implementing the right levels and frequencies of reporting, you and your team can identify issues as they arise and therefore have the widest array of options to tackle those problems.
***this hypothetical example is not an endorsement for breaking any traffic laws***